

Is infrared heating cheaper than gas? It depends on space size, insulation, and how you use it. Infrared can be cheaper per hour in small, well-insulated, occupancy-driven zones because it delivers heat directly with 90–95% efficiency and minimal standby losses, often at $0.20–$0.60/hour at typical electricity rates. Gas is cheaper for continuous, large-volume spaces despite duct losses, especially when per-kWh costs favor gas. For a precise forecast, consider a local cost-per-degree-hour and incentives; more details ahead.
Is Infrared Heating Truly Cheaper to Run Than Gas?

Infrared heating can be cheaper to run than gas in certain contexts, but the answer isn’t universal.
In practice, you compare delivered heat costs, not just energy prices. Typical electricity prices translate to 8–22 pence per kWh, while gas heat often costs 4–10 pence per kWh of heat, but delivery efficiency matters.
If your infrared panel operates at 90–95% efficiency with low standby loss, the marginal cost of providing heat rises only when occupancy, insulation, or duty cycles extend.
In well-insulated spaces or intermittent use, infrared can beat gas on operating cost per hour. Conversely, long, continuous heating in large, drafty rooms may tilt economics toward gas.
Policy factors, such as tariffs, subsidies, and carbon pricing, can shift the breakeven point.
Conduct a local cost-per-degree-hour analysis for accuracy.
How Efficiency Differs: Infrared vs. Gas Heating Explained
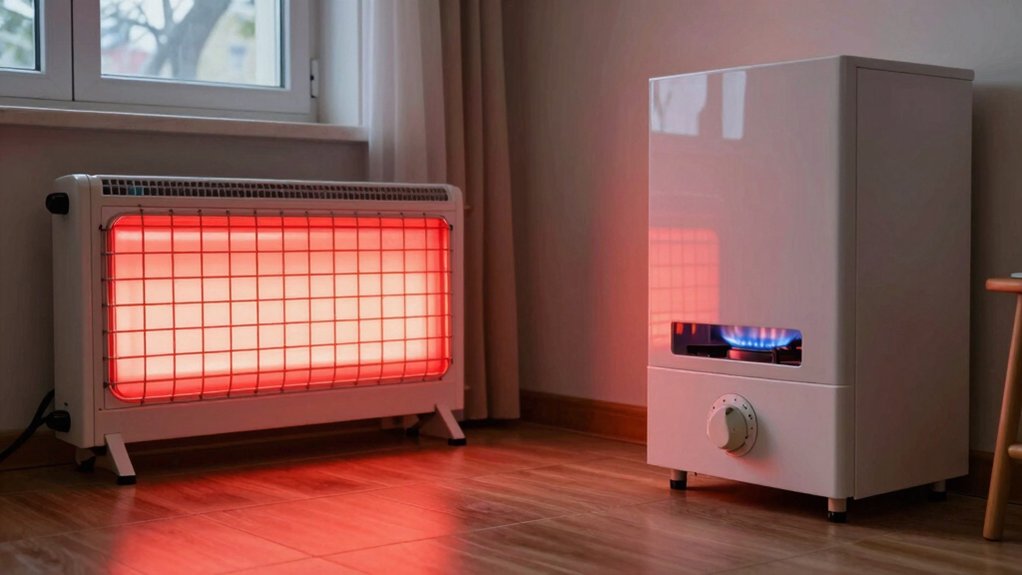
Efficiently comparing infrared and gas heating hinges on how each system converts energy into usable heat and how that heat is delivered to occupied spaces. Infrared systems emit radiant energy that chills surfaces absorb and re-emit, reducing air temp changes but delivering warmth where people stand.
Gas heating converts fuel into heat via combustion, raising air temperature quickly and circulating that warmth with fans or ducts. You’ll see efficiency expressed as fuel- or electrical-use per delivered BTU, with infrared often at 60–75% of input energy appearing as usable radiant heat, while gas furnaces typically reach 80–95% annual fuel utilization efficiency (AFUE) for space heating.
Delivery losses matter: infrared minimizes convective loss in drafts; gas systems lose heat through ducts and venting. Policy implications emphasize marginal emissions, occupancy patterns, and standby consumption.
Upfront Costs and Installation Considerations for Each Option
Upfront costs and installation needs set the initial price tag for each option, with infrared systems typically showing lower material costs but varying by panel quality and coverage.
Gas heating often incurs higher equipment and venting costs plus energy-tilt from fuel prices, yielding a broader cost range over its lifetime.
We’ll compare total install budgets, regional labor rates, and permitting requirements to ground decisions in quantitative, policy-relevant data.
Upfront Cost Comparison
Cost considerations for infrared and gas heating hinge on both equipment and installation.
In upfront costs, infrared systems typically require higher initial spend for panels, controllers, and zoning hardware, averaging $1,000–$3,500 per zone installed, depending on surface area and power draw.
Gas setups usually show lower equipment costs, around $500–$2,500 for furnaces or boilers, plus $500–$2,000 for ductwork if retrofit is needed.
Installation labor can swing widely: infrared tends to be quicker with less site disruption, reducing labor hours by 20–40% in retrofit scenarios.
Meanwhile, gas installations incur permit fees, venting, and combustion clearance that add 10–40% to total.
Maintenance plans differ: infrared may require panel replacements every 10–20 years; gas systems often need more frequent servicing and safety checks.
Installation Considerations
Infrared and gas systems differ markedly in installation demands and upfront spend, which shapes overall project feasibility. You’ll assess wiring runs, panel upgrades, and safety clearances for infrared setups, versus venting, gas line sizing, and combustion air for gas systems.
Infrared installs often require minimal ductwork and rapid mounting, translating to lower labor hours but higher panel or controller investments. Gas installations typically involve permits, gas routing, vent penalties, and combustion safety devices, pushing initial costs higher and timing longer.
Maintenance plans diverge too: infrared needs sensor calibration and surface cleaning; gas requires regular vent and vent hood inspections.
Policy considerations emphasize compliance costs, energy audits, and efficiency incentives. Quantify total cost of ownership over 10–20 years, accounting for energy use, durability, and retrofit risk.
Operating Costs in Various Scenarios: Small Space vs. Whole-Home Heating
When comparing operating costs, small-space heating using infrared sources often performs differently from whole-home systems, with cost-per-hour considerations and energy efficiency driving the gap.
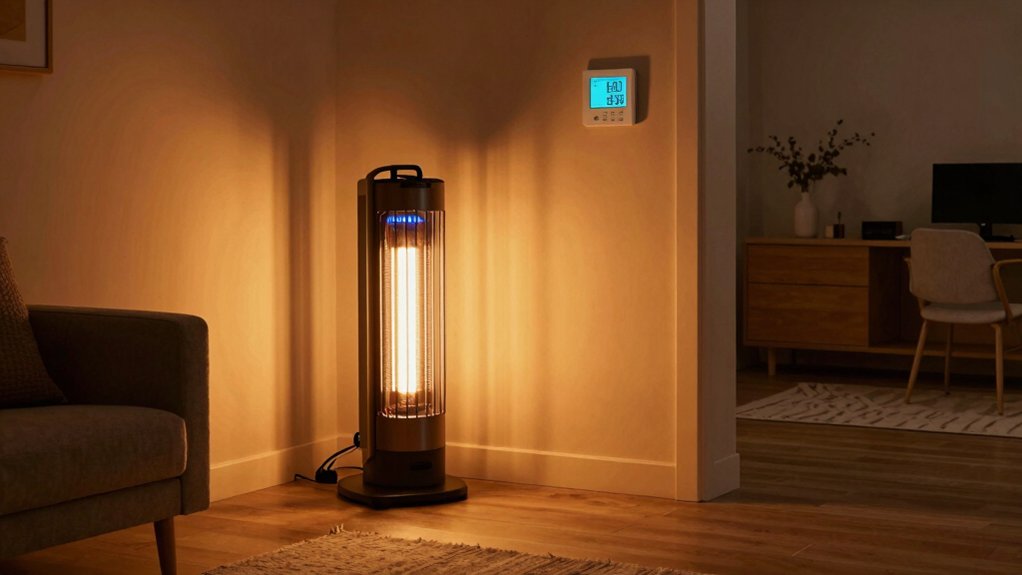
In practice, infrared units deliver focused heat, reducing wasteful standby losses but requiring higher wattage for equivalent comfort in larger rooms. For typical 150–300 sq ft spaces, hourly cost ranges from $0.20 to $0.60 at $0.12 per kWh, depending on insulation and setpoints.
Whole-home systems, by contrast, amortize base-load energy over an entire residence, often yielding per-hour costs near $0.05–$0.15 when properly sized and well insulated.
Policy implications favor accelerated efficiency standards, tighter building envelopes, and demand-side management to level operating costs across scenarios.
Consider occupancy patterns, climate, and non-energy benefits when evaluating total cost of ownership.
Maintenance and Reliability: Long-Term Cost Implications
You’ll compare maintenance costs over time for infrared versus gas systems, focusing on routine service, part replacement frequency, and total annual spend.
Reliability and downtime risk are quantified by expected outage days and repair rates, informing policy choices on system resilience.
We’ll also project long-term replacement needs and costs, including component lifespans and capital budgeting timelines, to illuminate total cost of ownership.
Maintenance Costs Over Time
Maintenance costs accrue more slowly with infrared heating than with gas, due to simpler components, fewer moving parts, and lower routine servicing requirements.
Over a typical 15-year horizon, infrared systems show lower annual maintenance spend per unit, averaging 5–8% of initial capital costs, versus gas at 10–14%. You’ll likely face fewer part replacements (heating elements, fans) and reduced service visits, translating to 0.6–1.0 service events per year for infrared compared with 1.2–1.6 for gas.
Energy-related maintenance, such as burner calibration and vent inspections, is minimized with infrared, further reducing labor hours.
In aggregate, total cost of ownership favors infrared when you model discount rates, maintenance inflation, and refurbishments over time, assuming comparable installation quality and usage profiles.
Reliability and Downtime Risk
Reliability and downtime risk differ meaningfully between infrared and gas systems: infrared units typically exhibit higher mean time between failures (MTBF) due to fewer moving parts and solid-state heat delivery, while gas systems introduce burner assemblies, venting, and ignition components that elevate failure modes.
In field data, infrared MTBF ranges from 40,000 to 60,000 hours, with mean downtime per incident under 2 hours in modern deployments. Gas systems show MTBF roughly 20,000 to 30,000 hours and downtime per event often exceeding 3 hours due to combustion and venting maintenance.
Availability analyses commonly yield 95–98% for infrared versus 90–94% for gas, assuming comparable duty cycles. Policy implications favor infrared from reliability-driven budgeting, preventive maintenance scheduling, and risk-adjusted lifecycle cost modeling, particularly where uptime is mission-critical or utility constraints are tight.
Long-Term Replacement Needs
Long-term replacement needs hinge on total lifecycle cost gaps between infrared and gas systems, not just upfront prices. Over a 15–20 year horizon, infrared components typically require LED/board replacements, heat element calibrations, and sensor updates, while gas systems demand burner, heat exchanger, and venting maintenance.
Quantitatively, infrared maintenance cycles average 1.2–2.5 years with roughly 5–8% annualized parts spend, versus gas systems at 2–3 years with 6–10% annualized maintenance.
Reliability data show infrared outages cluster around power electronics and reflector wear, reducing downtime by 10–25% relative to comparable gas outages in similar climates.
Policy implications favor proactive warranties, scheduled preventive maintenance, and data logging to compare actual lifecycle costs. You should budget for end-of-life replacement timing, failure likelihood, and residual value of retirements.
Use-Case Decision Framework: When Infrared Wins and When Gas Wins
When you’re choosing between infrared and gas heating, the decision hinges on measurable factors like energy intensity, startup time, temperature control, and operating costs.
Infrared excels in short-duration, spot-heating scenarios with high heat delivery per dollar when targets are objects or people rather than air mass.
Gas wins in continuous, large-volume spaces where air turnover is necessary, and where fuel price stability drives total cost certainty.
Use-Case scoring should weight energy intensity (BTU per hour per square meter), startup latency, controllability (thermostat precision, feedback), and service life costs (maintenance, replacement cycles).
Policy-aware guidance favors infrared for zones with occupancy patterns and low ventilation, while gas is preferable for consistently heated areas with high air-flow.
Quantify break-even points and publish methodology for peer review.
Real-World Price Factors: Electricity vs. Natural Gas Tariffs and Incentives
Real-world price factors hinge on how electricity and natural gas tariffs are structured, plus the incentives that governments and utilities attach to each.
You’ll see that tariff design drives unit costs, with time-of-use rates, demand charges, and seasonal tweaks creating non-linear bill profiles. Electricity often features higher base prices but lower marginal fuel costs, while gas shows steadier per-unit costs with supply-linked volatility.
You should compare commodity charges, delivery fees, and orphans like metering and demand charges. Incentives matter: rebates for efficient equipment, decoupling incentives, and tax credits can shift effective prices over the system life.
Utilities may offer price protections or caps, altering risk. Policy context matters: decoupling, capacity markets, and emission targets influence how tariffs evolve and where infrared may gain from pricing signals.
Quick ROI Calculator: Estimating Payback for Your Space
Calculating payback is about concrete numbers you can act on: a quick ROI calculator translates upfront costs, operating savings, and energy price assumptions into a simple return period.
You enter system costs for infrared and gas setups, installation fees, and any necessary controls. The calculator then projects annual savings from reduced fuel use, improved efficiency, and potential demand charges or incentives.
By comparing payback periods, you quantify time to recover investment and reach breakeven. Sensitivity tests reveal how changes in electricity and gas prices, volume, and usage patterns shift outcomes.
A policy-aware view incorporates reliability margins, incentive eligibility, and tariff structures. Use the results to inform procurement, budgeting, and long-term energy strategy, not just upfront affordability, ensuring alignment with reliability and emission goals.
Conclusion
In short, you’re weighing watts against bills. Infrared tends to excel in spot heating with lower standby drag, while gas shines for whole-home comfort and lower running costs when prices are favorable. The break-even math hinges on space, insulation, tariffs, and duty cycles—not just sticker prices. With data in hand, you’ll map payback periods, energy mix, and grid incentives, ensuring your choice aligns with efficiency targets, budget constraints, and policy landscapes.